Imaging water and fat
Imaging water and fat
Water, organ parenchyma (tissues of the hydrous type) and fat are the main constituents of the organism. Their molecules contain many hydrogen atoms whose nucleus is useful for the NMR signal. In a multitude of situations it is important to differentiate between the signal coming from water and organ parenchyma, and that of fat tissue. MRI can provide an excellent contrast between soft tissues by exploiting the particular characteristics of hydrogen atoms, according to whether they are bound to water or to lipid molecules.
Fat tissue signal
As fat tissues have a short relaxation time T1 they appear as a hypersignal in T1-weighted sequences.
The relaxation time T2 of fat is also short, but the fat still appears as a relative high signal intensity in multi-echoes T2-weighted sequences (TSE, FSE).
This fat high signal intensity can hide enhancement after Gadolinium injection in T1-weighted sequences, or an edematous hypersignal in fatty organs in T2-weighted sequences. It may be difficult to distinguish fat from other tissues with high T1 and T2 signal intensities (blood degradation products in a hematoma for example).
Furthermore fat is responsible for chemical shift artifacts and is also clearly visible in motion artifacts.
Fat signal suppression
There are two families of techniques to reduce or even suppress the signal from fat tissue, whatever the signal weighting:
- those based on the particular T1 of fat: inversion-recovery with short inversion time (STIR)
- those based on the differences in hydrogen resonance frequency in fat molecules compared to hydrogen resonance frequency in water and other soft tissues: fat saturation and selective excitation of water.
There are many applications of fat suppression methods: Identification of fat tissue, differentiation from blood clots, edema detection, enhancement after Gadolinium injection, reduction of chemical shift artifacts, MR spectroscopy, background suppression in MR angiography…
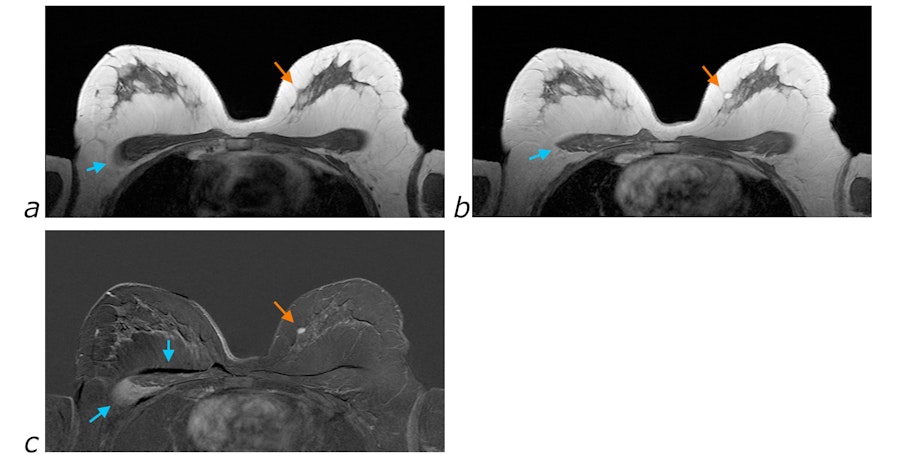
MRI of breast with fat signal
a. MRI in the axial plane before Gadolinium injection
b. MRI in the axial plane 5 minutes after Gadolinium injection: presence of nodular enhancement as a hypersignal
c. Subtraction of images before and after injection: better visualization of the enhanced nodule due to elimination of the fat hypersignal, appearance of subtraction artifacts (blue arrow) related to contraction of a pectoral muscle and a displacement of fat tissues